YouTube Retention Graphs Explained: Boost Your Video Performance
November 17, 2025
I've spent countless hours staring at YouTube retention graphs, trying to decode what they're telling me about my videos. If you've ever felt confused by those squiggly lines in YouTube Studio, you're not alone. Understanding retention graphs is one of the most powerful skills you can develop as a creator because they reveal exactly when and why viewers stop watching your content. These insights are pure gold for improving your videos and growing your channel.
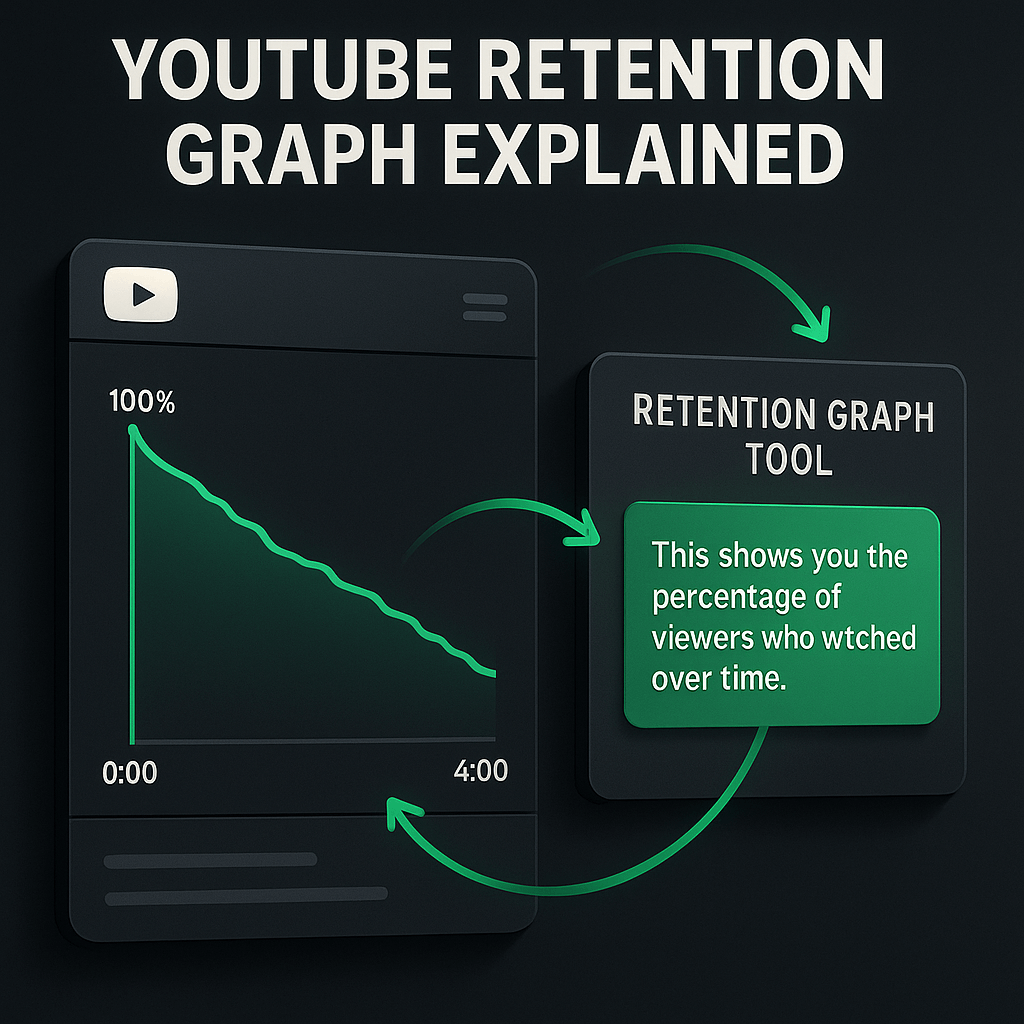
YouTube retention graphs show you the percentage of your video that viewers watch over time, and they're the closest thing we have to reading our audience's mind. When you know how to interpret these graphs, you can identify weak spots in your content, double down on what works, and create videos that keep people glued to their screens. In this guide, I'll walk you through everything you need to know about YouTube retention graphs, from basic interpretation to advanced optimization strategies that actually move the needle.
Key Takeaways
- YouTube retention graphs show exactly when and why viewers stop watching, making them your most valuable analytics tool for improving content quality and algorithmic performance.
- Focus on the first 30 seconds to hook viewers, the middle section to deliver consistent value, and the final 20% to signal quality to YouTube's recommendation system.
- Sharp drop-offs indicate problem areas in your content, while retention spikes reveal your strongest moments that viewers rewatch and engage with most.
- Audit your last ten videos to identify patterns in drop-off points, then systematically test improvements to intros, pacing, and content structure based on data.
- Use pattern interrupts strategically before typical drop-off points to re-engage viewers, and segment content to serve both beginners and advanced viewers effectively.
- Compare your retention to similar videos in your niche and length category rather than arbitrary benchmarks, and pay attention to relative retention for algorithmic insights.
- Tools like OpusClip can help identify high-retention segments before publishing and repurpose your best moments into clips that drive traffic back to long-form content.
What YouTube Retention Graphs Actually Show You
YouTube retention graphs display audience retention as a percentage on the vertical axis and video timeline on the horizontal axis. The line shows you what portion of your audience is still watching at any given moment in your video. A retention graph that starts at 100% and gradually slopes downward is normal; every video loses some viewers over time. What matters is how steep that slope is and where the dramatic drop-offs occur.
There are two types of retention metrics YouTube tracks: absolute retention and relative retention. Absolute retention shows the percentage of viewers who watched each moment of your video, while relative retention compares your video's performance to other YouTube videos of similar length. I focus primarily on absolute retention because it gives me concrete data about my specific audience's behavior, but relative retention helps me understand if I'm performing above or below average for my niche.
The graph also includes key moments marked by YouTube's algorithm, such as when viewers typically rewatch sections, skip ahead, or abandon the video entirely. These markers are incredibly valuable because they highlight the exact timestamps where something significant happened in your content. When I see a spike in the graph, I know that section resonated strongly and viewers rewatched it. When I see a cliff, I know I lost people fast and need to investigate why.
Average View Duration vs. Average Percentage Viewed
YouTube provides two primary retention metrics that often confuse creators: average view duration and average percentage viewed. Average view duration tells you the average amount of time viewers spent watching your video in minutes and seconds. Average percentage viewed tells you what portion of your total video length the average viewer watched. For a ten-minute video, a 50% average percentage viewed means viewers watched five minutes on average, regardless of which five minutes those were.
I've found that percentage viewed is more useful for comparing videos of different lengths. A three-minute video with 60% retention and a fifteen-minute video with 40% retention might both be performing well for their respective formats. The longer video keeps viewers engaged for six minutes, while the shorter one holds attention for less than two minutes, but the context matters. YouTube's algorithm considers both metrics when recommending videos, so you want to optimize for both high percentages and longer absolute watch times.
Reading Your Retention Graph Like a Pro
The shape of your retention graph tells a story about your video's performance. A healthy retention graph typically shows a steeper drop in the first 15 to 30 seconds as casual browsers decide whether to commit, then a more gradual decline throughout the middle, and sometimes another drop near the end as satisfied viewers leave. If your graph looks like a ski slope with a sharp, consistent downward angle, you have a content problem that needs addressing immediately.
I look for three critical zones when analyzing retention graphs. The first 30 seconds reveal whether your hook is working; if you're losing more than 40% of viewers in this window, your intro needs work. The middle section shows whether your content delivers on the promise of your title and thumbnail; steady retention here means you're providing value. The final 20% of your video indicates whether viewers found your content satisfying enough to watch until the end, which signals quality to YouTube's algorithm.
Identifying Drop-Off Points and What They Mean
Sharp drops in your retention graph are diagnostic tools that show exactly where you're losing viewers. When I see a sudden cliff in the graph, I immediately jump to that timestamp in my video to see what happened. Common culprits include long-winded explanations, technical difficulties, tangents that don't serve the main topic, or moments where the pacing drags. Sometimes the drop happens right after you deliver the main value, which tells me I need to tease additional insights earlier to keep people watching.
Not all drop-offs are bad, though. If viewers watch 80% of your video and then leave, they probably got what they came for and felt satisfied. That's actually a win. The problematic drops are the ones that happen early or in the middle of your content, especially if they're steep and sudden. I've learned to treat these drops as feedback; my audience is telling me something isn't working, and it's my job to figure out what and fix it in future videos.
Retention Spikes and Rewatch Patterns
When your retention graph shows a spike where the line goes above 100%, it means viewers rewatched that section of your video. These spikes are golden opportunities to understand what resonates most with your audience. I've noticed spikes often occur during particularly valuable tips, funny moments, or complex explanations that viewers need to hear twice. When I identify these high-value moments, I try to create more content in that style or format.
YouTube also shows you where viewers skip ahead in your video, which appears as a dip followed by a slight recovery in the retention line. This pattern tells me that section wasn't compelling enough to watch in real time, but viewers still wanted to see what came next. If I see consistent skip patterns in a particular section across multiple videos, I know that type of content isn't serving my audience well and I should either cut it or make it more engaging.
How to Improve Your YouTube Retention Step by Step
Improving retention requires a systematic approach based on data, not guesswork. I've developed a process that consistently helps me create videos with better retention, and it starts with analyzing your existing content to identify patterns. Here's exactly how I do it, broken down into actionable steps you can implement immediately.
Step 1: Audit Your Last 10 Videos
Open YouTube Studio and navigate to the Analytics tab, then click on the Engagement section to view retention graphs for your recent videos. Look at your last ten uploads and note the average percentage viewed for each one. Identify your top three performers and your bottom three performers in terms of retention. This gives you a baseline understanding of what's working and what isn't on your channel right now.
Step 2: Map Common Drop-Off Patterns
For each of the ten videos you audited, note where the major drop-offs occur and what was happening at those timestamps. Create a simple spreadsheet with columns for video title, drop-off timestamp, and what was happening in the video at that moment. After reviewing all ten videos, look for patterns; you might discover that you consistently lose viewers during intros, transitions, or certain types of content segments.
Step 3: Strengthen Your First 30 Seconds
Based on your audit, redesign your video intros to hook viewers faster. Cut any fluff, branding, or long explanations before delivering value. I start my videos by immediately addressing the viewer's problem or teasing the most valuable insight they'll get from watching. Test different hook styles like pattern interrupts, bold statements, or quick previews of results, then compare retention graphs to see which approach works best for your audience.
Step 4: Restructure Problem Sections
Take the sections where you identified consistent drop-offs and experiment with different approaches. If viewers leave during explanations, try using more visuals or breaking complex ideas into smaller chunks. If they drop off during certain content types, consider cutting those segments entirely or moving them to later in the video when you've already provided core value. The goal is to eliminate friction points that give viewers a reason to click away.
Step 5: Add Retention Hooks Throughout
Every two to three minutes, give viewers a reason to keep watching by teasing upcoming content or delivering a quick win. I use phrases like "in a moment I'll show you," "coming up next," or "but here's the thing most people miss" to create curiosity gaps that pull viewers forward. These micro-hooks work especially well in the middle section of longer videos where retention naturally starts to sag.
Step 6: Test and Iterate Based on Data
After implementing changes, wait until your new videos have at least 1,000 views, then compare their retention graphs to your baseline. Look for improvements in average percentage viewed and fewer dramatic drop-offs. Keep what works and refine what doesn't. I treat every video as an experiment and use retention data as my primary success metric, even more than views or likes, because retention directly impacts how YouTube promotes my content.
Advanced Retention Strategies That Actually Work
Once you've mastered the basics of reading and improving retention graphs, you can implement more sophisticated strategies that top creators use. These techniques require more effort but deliver outsized results when executed well. I've tested dozens of retention tactics over the years, and these are the ones that consistently move the needle for me and the creators I advise.
The Pattern Interrupt Technique
Pattern interrupts are unexpected changes in your video that snap viewers back to attention when their focus starts to drift. These can be visual changes like switching camera angles, audio shifts like changing background music, or content surprises like revealing an unexpected insight. I strategically place pattern interrupts right before typical drop-off points in my retention graphs. For example, if I know viewers tend to lose interest around the four-minute mark, I'll introduce a new visual element or shift the energy of my delivery at 3:45 to re-engage them before they think about leaving.
The key is making pattern interrupts feel natural rather than gimmicky. I avoid overusing them because too many changes can feel chaotic and actually hurt retention. Instead, I use them sparingly at strategic moments where data shows my audience needs a refresh. When done right, you'll see small bumps or plateaus in your retention graph at these moments, indicating that the technique successfully re-engaged viewers who were about to leave.
Segmenting Content for Different Viewer Types
Not all viewers come to your video with the same goals or knowledge level. I've found success by structuring videos to serve both beginners and advanced viewers without alienating either group. The technique involves front-loading essential information that everyone needs, then clearly signposting advanced sections that beginners can skip. I'll say something like "if you're already familiar with the basics, jump to 4:30 for advanced strategies" while also providing timestamps in the description.
This approach improves retention because it gives viewers permission to navigate to the content most relevant to them rather than sitting through sections that don't apply. When I check retention graphs on these videos, I see viewers skipping ahead to their preferred sections but staying engaged once they get there, which results in higher overall retention than if I'd forced everyone through a linear structure.
Using OpusClip to Test Retention Winners
One strategy I've adopted is using OpusClip to identify which segments of my long-form content have the highest retention potential before I even publish. OpusClip's AI analyzes your footage and automatically identifies the most engaging moments, essentially predicting which clips will hold attention. I upload rough cuts of my videos to OpusClip and see which segments it selects as high-value clips; these are often the same sections that later show retention spikes in my YouTube analytics.
This gives me a preview of what's working before my video goes live, allowing me to restructure content to lead with these high-retention moments or expand on them. I can also use OpusClip to repurpose my best-performing segments into short-form content for YouTube Shorts, which drives traffic back to my long-form videos. The platform's automatic captioning and reframing features ensure these clips are optimized for retention across different formats and platforms.
Common Retention Graph Mistakes to Avoid
Even experienced creators make critical errors when interpreting retention data. I've made most of these mistakes myself, and they cost me months of growth until I learned to read the data correctly. Understanding what not to do is just as important as knowing best practices, so let me walk you through the most common pitfalls I see creators fall into when working with retention graphs.
The biggest mistake is obsessing over retention percentage without considering context. A 30% average percentage viewed might be terrible for a three-minute tutorial but excellent for a 45-minute documentary-style video. I've seen creators panic over retention numbers that are actually quite good for their content type and video length. Always compare your retention to similar videos in your niche and of similar length, not to completely different content categories.
Misinterpreting Early Drop-Offs
Many creators see the steep drop in the first 15 seconds and assume their entire video is failing, but this initial drop is completely normal. YouTube shows your video to a broad audience initially, including people who aren't genuinely interested in your topic. These viewers leave quickly, and that's okay; they were never your target audience anyway. What matters is whether you're retaining the viewers who make it past the 30-second mark, as these are the people who actually chose to engage with your content.
I focus on the retention curve from 30 seconds onward rather than getting discouraged by the initial drop. If I'm keeping 60% of viewers who make it past the intro, that's a strong signal that my content is resonating with my target audience. The goal isn't to retain every single viewer who clicks; it's to retain the right viewers who will watch, engage, and come back for more.
Ignoring Relative Retention Metrics
While I primarily focus on absolute retention, ignoring relative retention entirely is a mistake. Relative retention shows how your video performs compared to other YouTube videos of similar length, giving you context for whether your retention is actually good or just feels good. I've had videos with 45% absolute retention that had 150% relative retention, meaning they performed 50% better than the average video of that length. This tells me I'm doing something right even if the absolute number seems low.
YouTube's algorithm pays attention to relative retention when deciding which videos to promote. A video that outperforms similar content in its niche gets a boost in recommendations, even if its absolute retention isn't spectacular. I check both metrics and celebrate when my relative retention is high, as it indicates my content is competitive within the YouTube ecosystem.
Frequently Asked Questions
What is a good retention rate for YouTube videos?
A good retention rate depends on your video length and niche, but generally, 50% or higher average percentage viewed is strong for videos under ten minutes, while 40% is solid for longer content. Educational content typically sees higher retention than entertainment, and shorter videos naturally achieve higher percentages than longer ones. Focus on improving your own baseline rather than chasing arbitrary numbers, and pay attention to relative retention to see how you compare to similar videos.
Why does my retention drop so much in the first 15 seconds?
The initial drop is normal because YouTube tests your video with a broad audience, including viewers who aren't genuinely interested in your topic. Many people click out of curiosity or because of an appealing thumbnail but leave quickly when they realize the content isn't for them. This isn't a failure; it's the algorithm filtering for your actual target audience. Focus on retaining viewers who make it past 30 seconds, as these are the people who chose to engage with your content.
How often should I check my retention graphs?
I check retention graphs for new videos once they reach 1,000 views to get statistically significant data, then again at 10,000 views to see if patterns hold. Checking too early can be misleading because small sample sizes create erratic graphs. For older videos, I review retention quarterly to identify evergreen content that consistently performs well and underperformers that might benefit from updated thumbnails or titles. Avoid obsessively checking daily, as retention patterns stabilize over time.
Can I improve retention on videos that are already published?
You can't change the video file itself without re-uploading and losing all your existing views and engagement, but you can optimize elements that affect future retention. Update your title and thumbnail to set more accurate expectations, add or improve timestamps in the description to help viewers navigate to relevant sections, and pin a comment that addresses common questions or directs viewers to the most valuable part. These changes can improve retention for new viewers discovering your video.
Do YouTube Shorts have retention graphs?
YouTube Shorts do have retention data, but it's displayed differently than long-form content because of the unique viewing behavior on Shorts. Viewers swipe through Shorts quickly, so retention metrics focus on whether viewers watched the entire Short and whether they swiped away or kept watching. The retention principles still apply; you need to hook viewers immediately and maintain interest throughout, but the time scale is compressed to seconds rather than minutes.
How does retention affect the YouTube algorithm?
Retention is one of the most important signals YouTube's algorithm uses to determine which videos to recommend. High retention tells the algorithm that your content is valuable and keeps viewers on the platform longer, which is YouTube's primary goal. Videos with strong retention get promoted more aggressively in suggested videos, search results, and homepage recommendations. The algorithm particularly values videos that outperform similar content in their niche, which is why relative retention matters for growth.
Should I make shorter videos to improve retention percentage?
Making videos shorter just to boost retention percentage is a mistake if it means cutting valuable content. YouTube's algorithm rewards total watch time as much as percentage viewed, so a longer video with 40% retention might perform better than a shorter video with 60% retention if the absolute watch time is higher. Focus on making your videos as long as they need to be to deliver complete value, then work on improving retention within that length by cutting fluff and maintaining strong pacing throughout.
Start Using Retention Data to Grow Your Channel
Understanding YouTube retention graphs transforms you from a creator who guesses what works to one who knows exactly how to improve. I've seen my own channel grow exponentially once I started treating retention data as my primary feedback mechanism, and I've watched countless other creators experience the same breakthrough. The graphs don't lie; they show you precisely what your audience wants and where you're losing them, giving you a clear roadmap for improvement.
The key is taking action on what the data tells you. Start by auditing your recent videos, identifying patterns in your retention graphs, and implementing the strategies I've outlined in this guide. Test different approaches, measure the results, and double down on what works for your specific audience. Remember that improving retention is an iterative process; every video is an opportunity to learn and refine your craft based on real viewer behavior.
If you're creating long-form content and want to maximize its reach, consider using OpusClip to identify and repurpose your highest-retention moments into engaging clips. The platform's AI-powered analysis helps you spot the segments that resonate most with viewers, and its automatic captioning and reframing features ensure your clips are optimized for retention across all platforms. By combining strong retention strategies with smart repurposing, you'll create a content system that grows your channel efficiently and sustainably. Your retention graphs are waiting to tell you exactly what your audience wants; all you have to do is learn to listen.
FAQs
No items found.